Charts questions

I’m excited for the new charts plugins as I have a couple of clients that regularly need to show data on their sites. I have a few questions here right off the bat when implementing these.

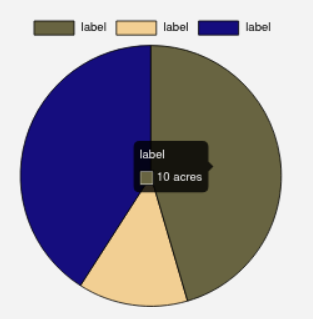
Question 1: How do I show units in the tooltip information box. See this screenshot:


In this case I need it to say Acres after the number.

Question 2: There doesn’t appear to be an option for a scroll trigger for the animation. Which means that any chart below the fold is just going to appear static by the time a user gets there. Am I missing something here?

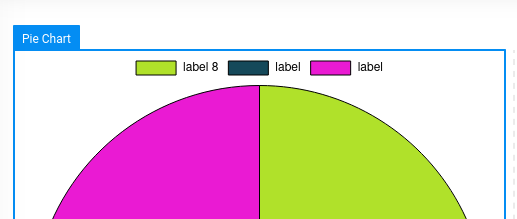
Question 3: Is there a way to show the dataset in the key with separate styling from the main label, so users aren’t required to hover over the chart to see the actual data? I could just make my own key from scratch but I would lose the filtering ability that comes with it.

Cheers

1 Like

Hello and thanks for your interest in Cornerstone Charts.

  1. I’m going to need to make an important point release for this one. Certain tooltip displays require extensions upon Chart.js and if this is a popular one for showing units we can add controls for it as well. What I’d like to do first is create a frontend API so we can share snippets. In your example you would use something like the following after that is released.

image

// Filter the config of a CS Chart
window.csGlobal.csHooks.filter("cs_charts_config", function(config) {
  // Tooltip building callbacks
  config.options.plugins.tooltip.callbacks = {
    // The individual point of data label
    label: function(context) {
      return context.parsed + " acres";
    }
  };
  
  // Return with our changes
  return config;
});
  1. That’s a feature that really needs to be shared by a lot JS elements, and for custom elements. It does not exist currently though. I plan on creating the control in the customize section and adding it here and places. Look out for “Render only when in viewport” or something similar to that.

  2. I’m assuming you are referring to the Legend here? If you add the data to the Labelset > Label if effectively gives the same result. Let me know if I missed the mark here.

Have a great day!

image

image

Thanks for the response, it sounds like there are still a few things in the works for this. On my last point, I did mean to say Legend. While I can add the data to the Value field of the label it doesn’t allow for any distinct styling from the main label, which ends looking a bit messy, especially with longer labels. Ideally I’d want the data to be on a second line and a lighter weight from the main label.

Basically I’d like the legend to look like this

Okay well I think the first two points we can get into the codebase quickly. You will be able to use that filter in #1 in the 1.0.1 update as well. From what I read creating that legend would be a little more involved, but it’ll at least be possible through the filter I provided. Docs to come as well.

Long term, we plan on giving you the ability to create HTML legends, Tooltips, and the likes in Cornerstone itself. These are all dynamic in the frontend sense, so it would be a little different then Dynamic Content, but similar. Version 1.0 we wanted to give you everything that Chart.js offers through it’s normal API.

https://www.chartjs.org/docs/latest/samples/legend/html.html

This topic was automatically closed 10 days after the last reply. New replies are no longer allowed.