visualize your data WITH EASE
Meet the ultimate data visualization tool for WordPress and Cornerstone. Powered by the popular chart.js library & packed with popular features like native controls, pre-configured charts, and support for dynamic content – your creativity just got a (major) upgrade.
Create interactive pages, display static information, or build custom dashboards like this that tap into your own dynamic content. We're just scratching the surface of what you can do with this incredible visualization tool for WordPress and Cornerstone.
Choose from six baseline visualization formats and customize your design from there.
Cornerstone Charts comes preconfigured with six beautifully rendered javascript visualization elements – each with their own ready-built animations, baseline label and dataset parameters, and detailed option controls.
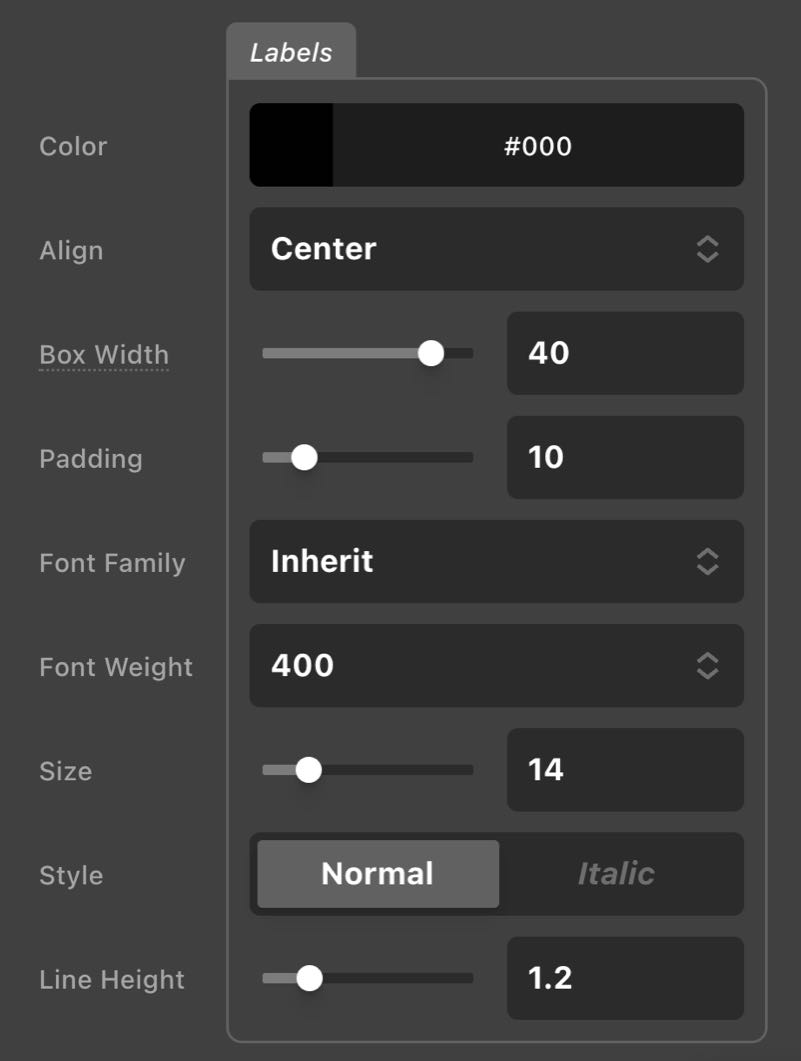
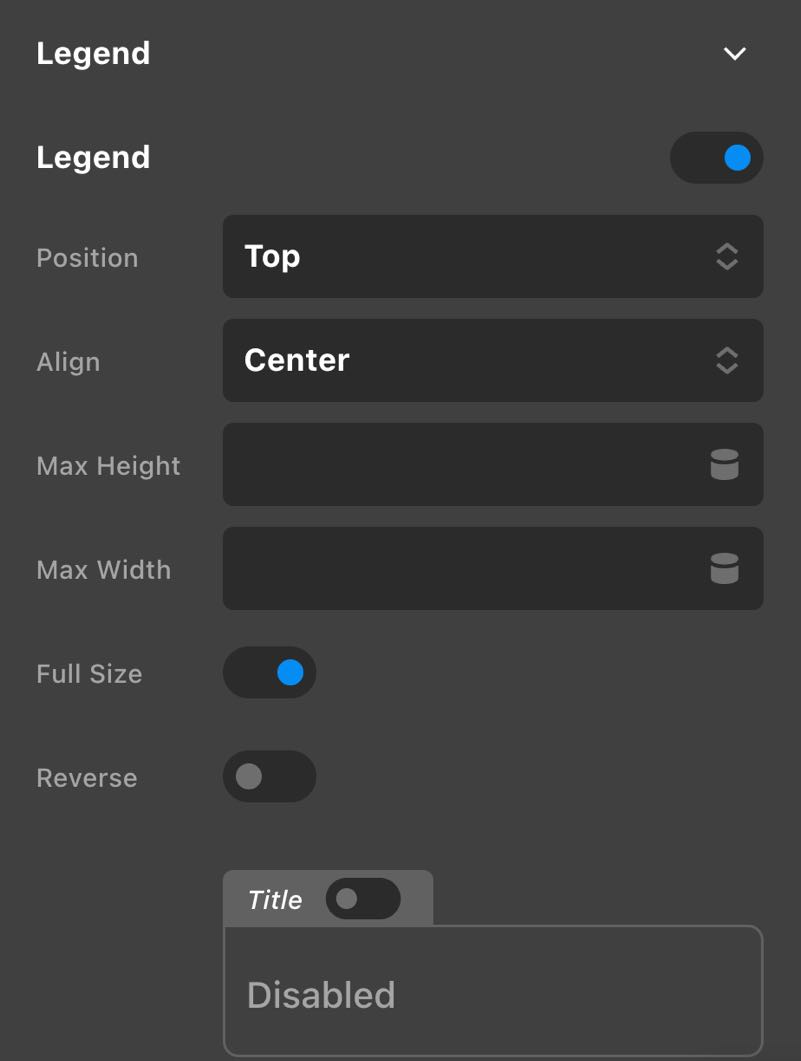
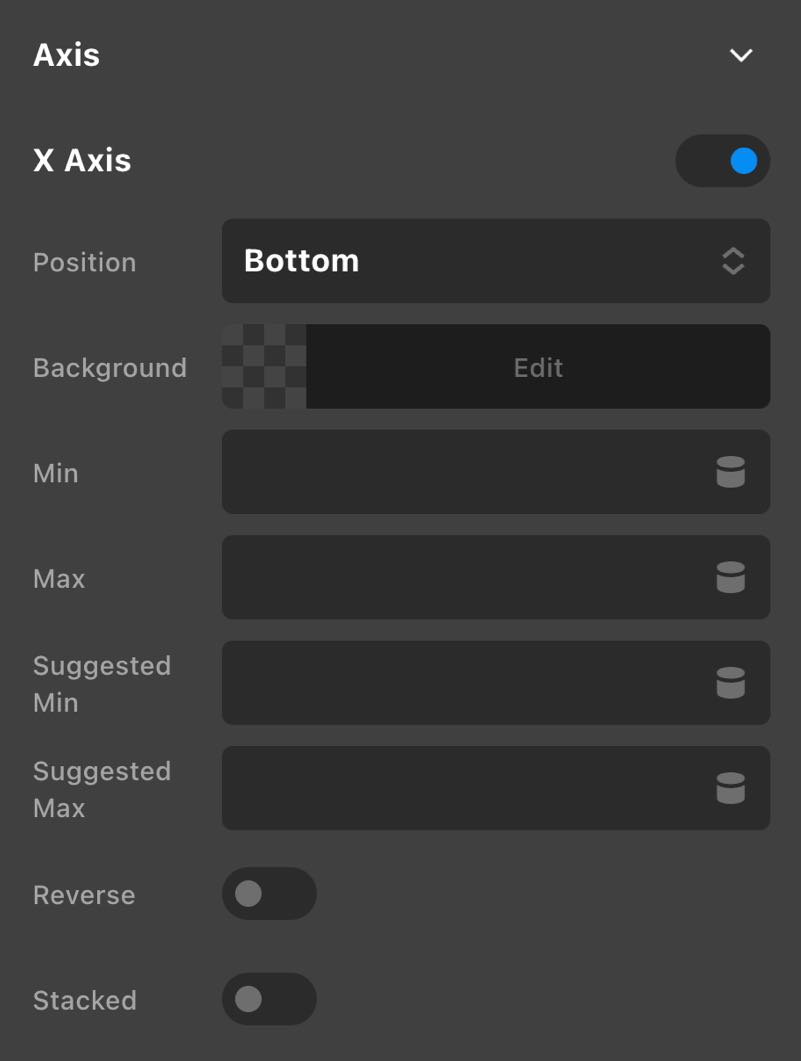
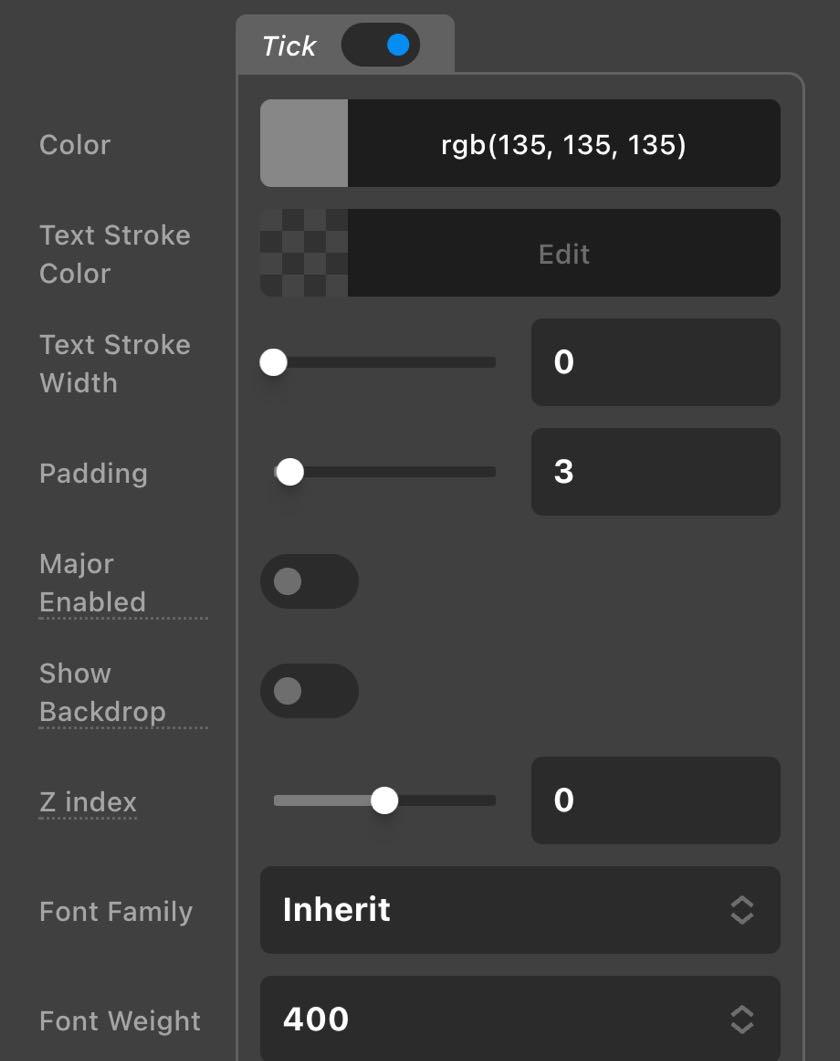
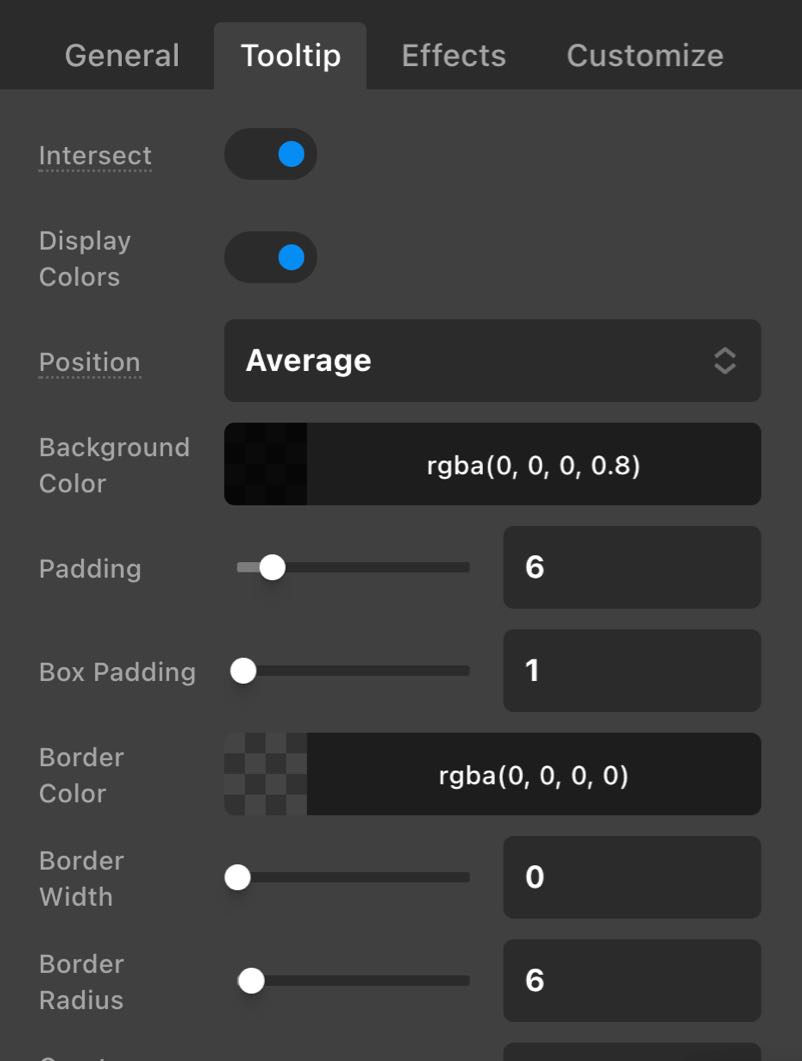
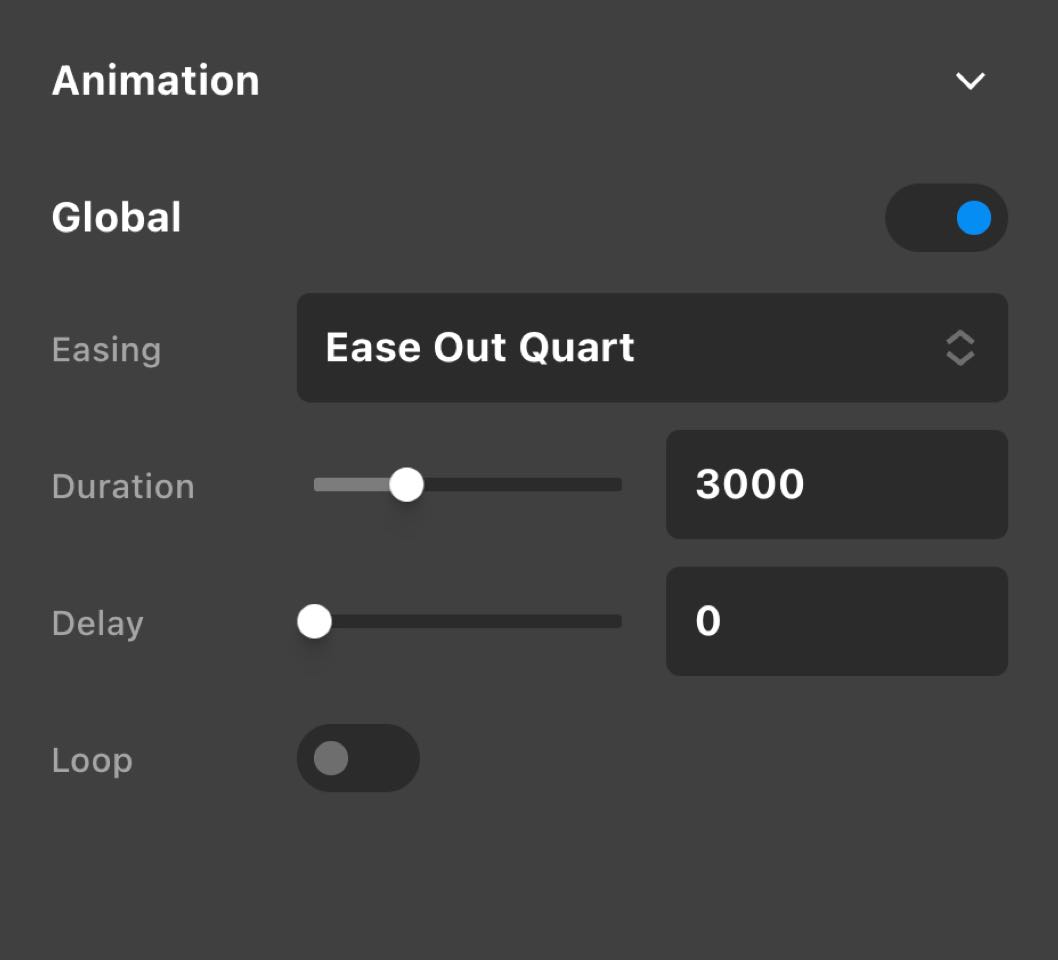
configure your charts with ease thanks to cornerstone's powerful controls.
Cornerstone Charts was built to work seamlessly within the Cornerstone interface. Utilize familiar control options to adjust every last detail of your chart from dataset colors and labels to legends, axis and so much more.
source your charts with Data from throughout your site, third party Plugins, and beyond.
Cornerstone Charts is the premier plugin for creating beautiful charts leveraging dynamic content all throughout your WordPress site. Effortlessly integrate your theme colors and site data without ever writing a line of code.
THE SKY's the limit
Custom dashboards
Easily build custom dashboards for logged-in users leveraging account data, user meta, membership info, and more!
BESPOKE calculators
Generate and visualize user inputs calculated by custom formulas using tools like Gravity Forms with CS Charts.
Mini Web AppLICATIONS
Blur the lines between static sites and app-like experiences with beautifully interactive charts and a little ingenuity.
Engaging Experiences
Increase your on-page engagement by creating interactive visualizations of otherwise monotonous text.
Interactive Infographics
Powered by everything
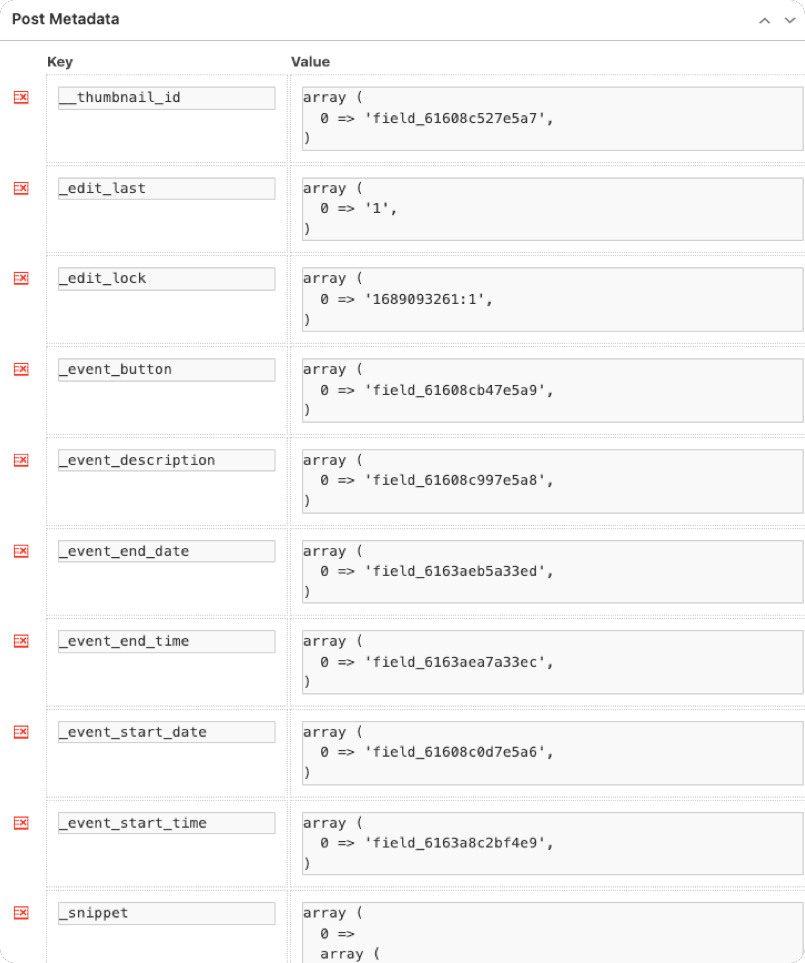
Visualize just about anything on your site. If it's in your database, you can access it with our standard dynamic content.
You've got questions? We've got answers.
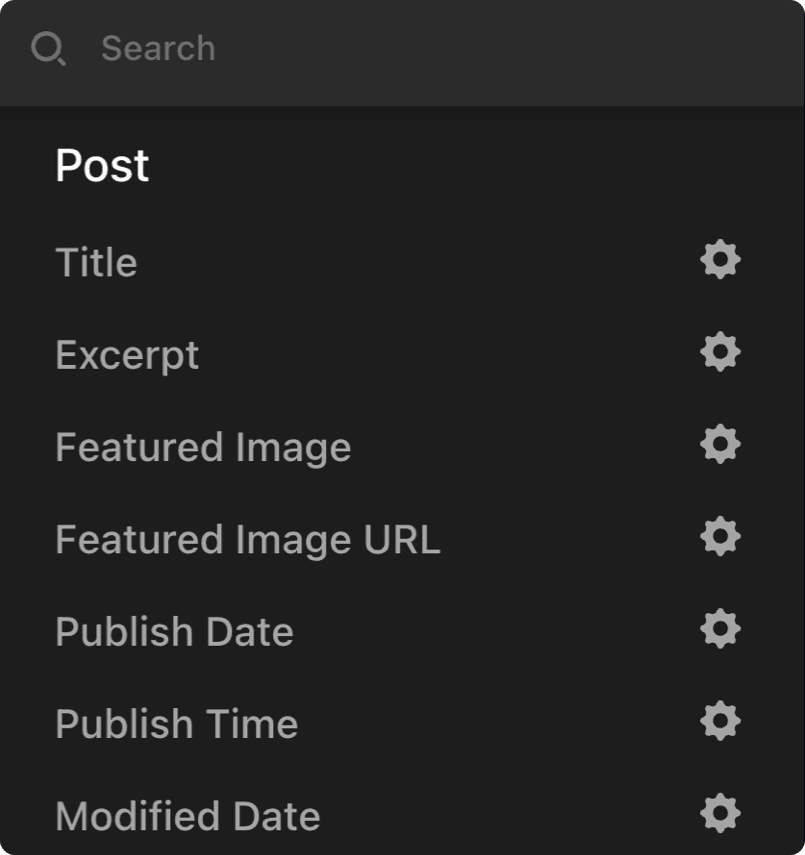
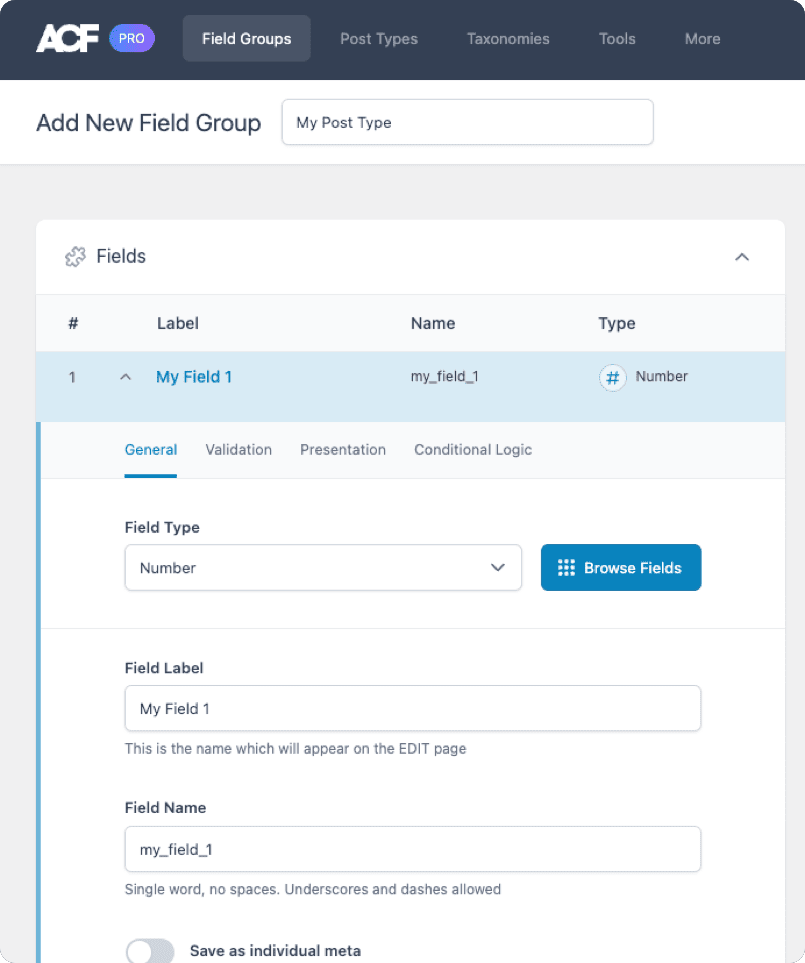
Define your data
Specify your data structure from WordPress core data to Custom Post Types, ACF fields, general plugin data and so much more.
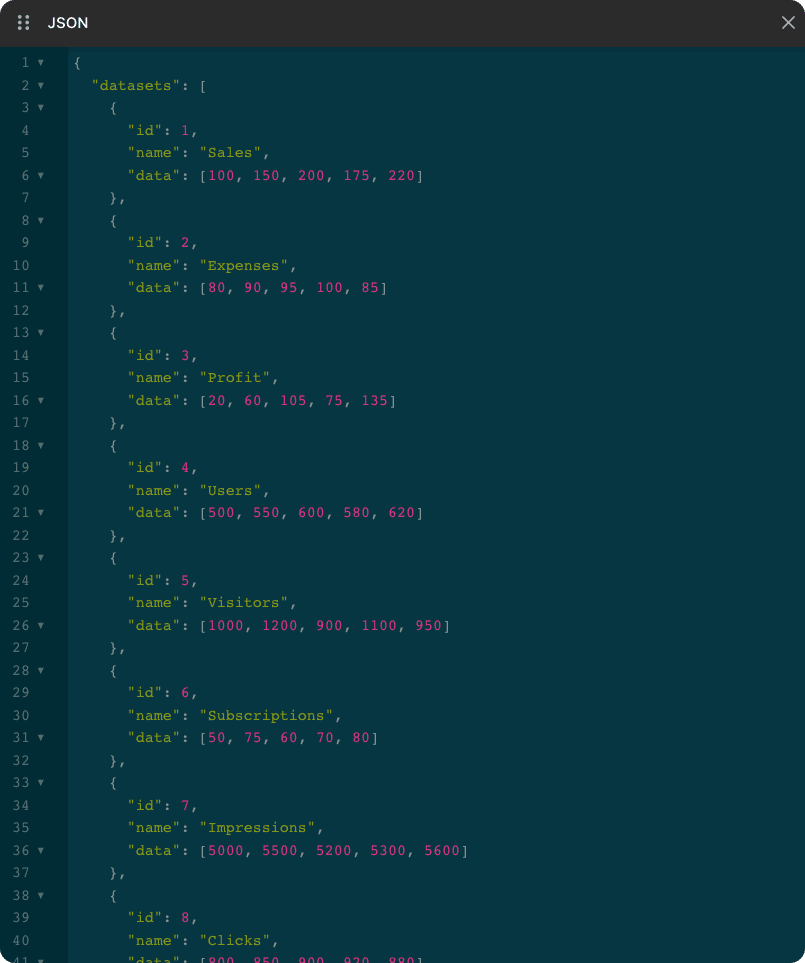
Create Your Data
Pipe data into your website – manually, programmatically, user generated, plugin powered.
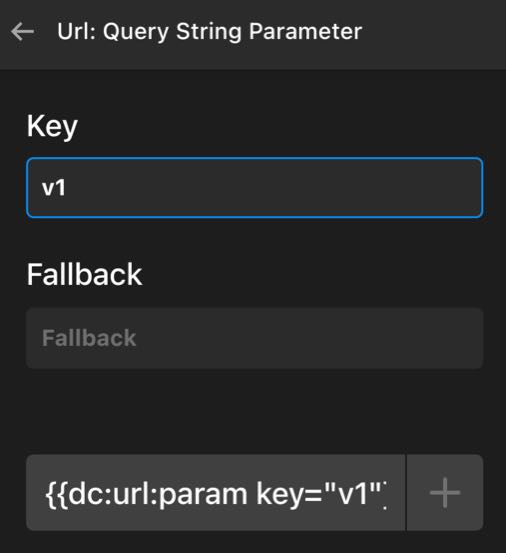
Access your data
Tap into your data with Cornerstone's built-in dynamic content syntax allowing access to nearly anything in your database.
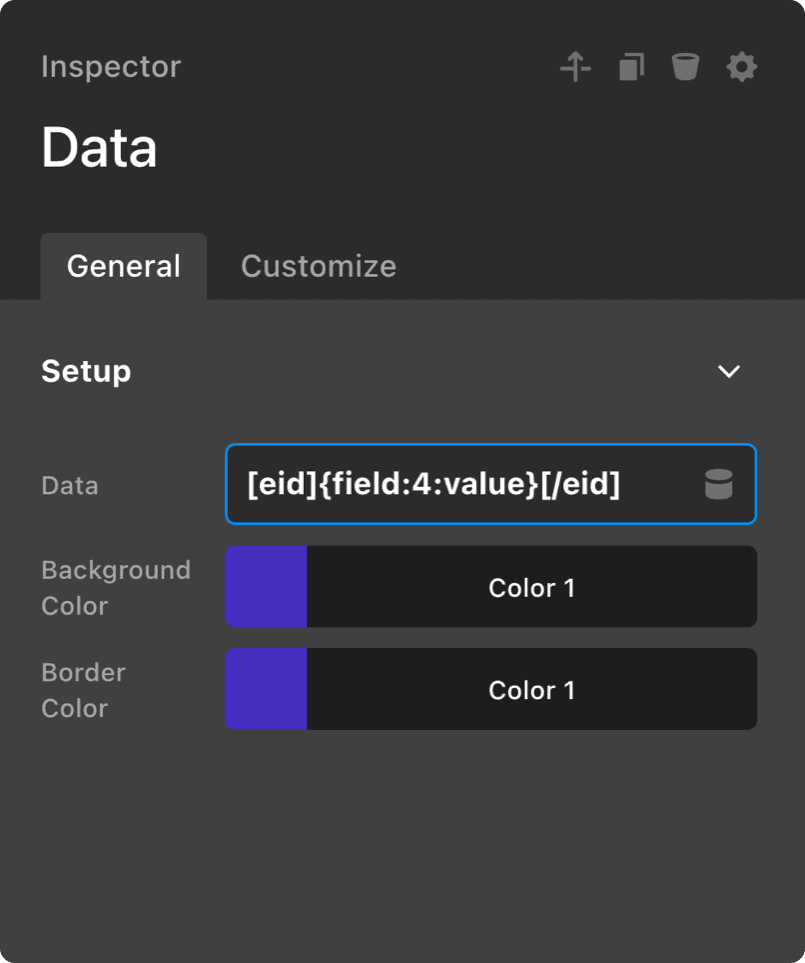
Visualize Your Data
Pipe your dynamic content into any of the data visualization elements to populate labelsets, datasets, colors, and so much more.
Houston, we've got visuals.
$697 $996
One Time
Your website, at its best. Get instant access to the Pro Theme, Cornerstone Builder, and Cornerstone Charts.
Unlimited Use
Lifetime Updates
Pro Theme
Cornerstone Builder
Cornerstone Charts Plugin
Who is this for? Great for new or existing Themeco customers and includes everything you need to build creative and interactive websites.

$75 $249
One Time
Purchase for instant access to the Cornerstone Charts Plugin. Visualize your website data with ease!
Unlimited Use
Lifetime Updates
Bar Chart
Pie Chart
Line Chart
Radar Chart
Bubble Chart
Scatter Chart
Doughnut Chart
Custom Events Calendar
Polar Area Chart
And so much more!
Who is this for? Great for existing Themeco customers who just want to purchase Cornerstone Charts. Use it with all of your existing licenses.

From $99
/year
Pro Max includes Pro and Cornerstone plus our entire lineup of plugins, courses, and templates. About Max.
CSAI ($749 Value)
Personify ($599 Value)
Cornerstone Charts ($249 Value)
Web Design Magic ($249 Value)
Modern Sliders ($199 Value)
Super Loopers ($249 Value)
Gridorama ($199 Value)
SiteDrive ($749 Value)
Cornerstone Forms (Coming Soon)
Future Max Products (Priceless)
Who is this for? Great for new or existing Themeco customers and includes Pro, Cornerstone, plus all current & future Max products.